B.10 Workflows for software developers
Software developers find useful information in the following workflow descriptions.
B.10.1 Workflow list
-
Section B.10.2
As a software developer, I can process scenario information and/or simulation results from different software/hardware releases and produce comparison charts to provide trend and gap analysis.
B.10.2 Processing and comparing results
B.10.2.1 Workflow short description
As a software developer, I can process scenario information and/or simulation results from different software/hardware releases and produce comparison charts to provide trend and gap analysis.
B.10.2.2 Workflow detailed description
Software developers have the need to process scenario information or simulation results from different software or hardware releases. They also need to produce comparison charts to provide trend and gap analysis. OpenSCENARIO 2.0 must allow them to do so.
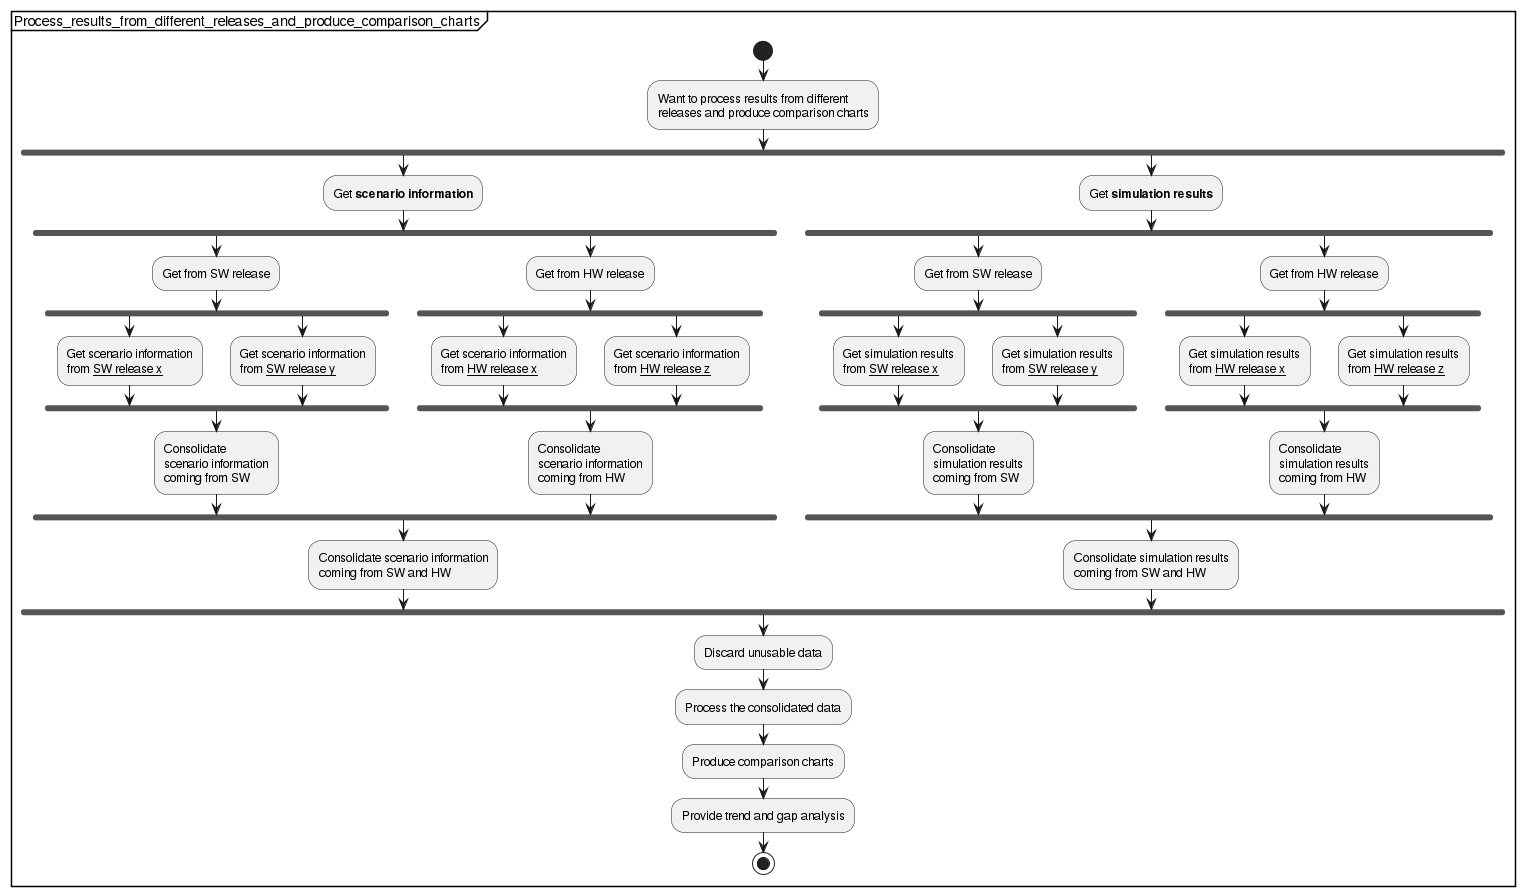
B.10.2.4 Steps for processing and comparing results
Software developers can use OpenSCENARIO 2.0 to produce comparison charts or to provide trend and gap analysis following these steps:
-
Get the all the scenario information.
Starting point is lots of information. -
Divide the information by software and hardware releases
The data is now loosely classified information. -
Divide the information again by software sub-release and hardware sub-release.
The data is now nicely classified information. -
Consolidate all the software information together and all the hardware information together.
The data is now partially consolidated information. -
Consolidate all the information together.
The data is now fully consolidated information. -
(Repeat for the simulation results.
You get Complete fully consolidated information.) -
Discard the unusable data.
You get complete usable fully consolidated information. -
Process the information.
You get processed data. -
Produce comparison charts.+ This creates your first wanted deliverable.
-
Provide trend and gap analysis.
This creates your second wanted deliverable.
At the end of the process software developers have the comparison charts and the trend/gap analysis they wanted.